When you’re troubleshooting an issue on calendar views or single pages, one of the most important diagnostic tools is your browser’s JavaScript Console. This console logs behind-the-scenes activity, including any errors that might be preventing parts of your calendar from working correctly.
If you’re working with our support team, we may ask you to send a screenshot of your browser’s JavaScript Console. This guide walks you through how to open the JavaScript Console in supported browsers and how to capture any relevant errors.
Why the JavaScript Console Is Important
Many features of our calendar rely on JavaScript to function properly, like calendar navigation, tickets, RSVPs, imports, filters, and API requests. If something breaks, JavaScript errors will usually appear in the console, even if the problem isn’t visible on the surface.
Capturing these errors gives us essential insights into:
- Plugin or theme conflicts
- Caching or loading issues
- Outdated versions of our plugins
- Missing files or dependencies
- Errors from custom scripts or overrides
How to Access the JavaScript Console (Per Browser)
Here’s how to open the Console in the most commonly used browsers supported by The Events Calendar:
Google Chrome
- Press
Ctrl + Shift + J(Windows/Linux) orCmd + Option + J(Mac) - Or: Right-click anywhere on the page → click Inspect → select the Console tab
Mozilla Firefox
- Press
Ctrl + Shift + K(Windows/Linux) orCmd + Option + K(Mac) - Or: Right-click → Inspect → Console tab
Microsoft Edge
- Press
Ctrl + Shift + J(Windows) orCmd + Option + J(Mac) - Or: Right-click → Inspect → Console
Safari
- First, enable the Developer Menu in Safari Preferences under Advanced → Check “Show Develop menu in menu bar”
- Then press
Cmd + Option + Cor go to Develop → Show JavaScript Console
How to Capture a JavaScript Error
To properly capture a JavaScript error for support:
- Reproduce the issue on your site
Visit the page where the issue is happening (e.g., single event page, calendar view, etc.). - Open your browser’s JavaScript Console
Use the shortcut or steps listed above for your browser. - Refresh the page (important!)
This ensures that the browser logs all JavaScript activity and any errors that occur during page load. - Trigger the issue again
If the issue occurs after working with filters, navigating the calendar, submitting an RSVP or purchasing tickets, repeat those steps. - Look for red text in the Console
Errors will be clearly marked in red. These are the messages we need to diagnose the issue.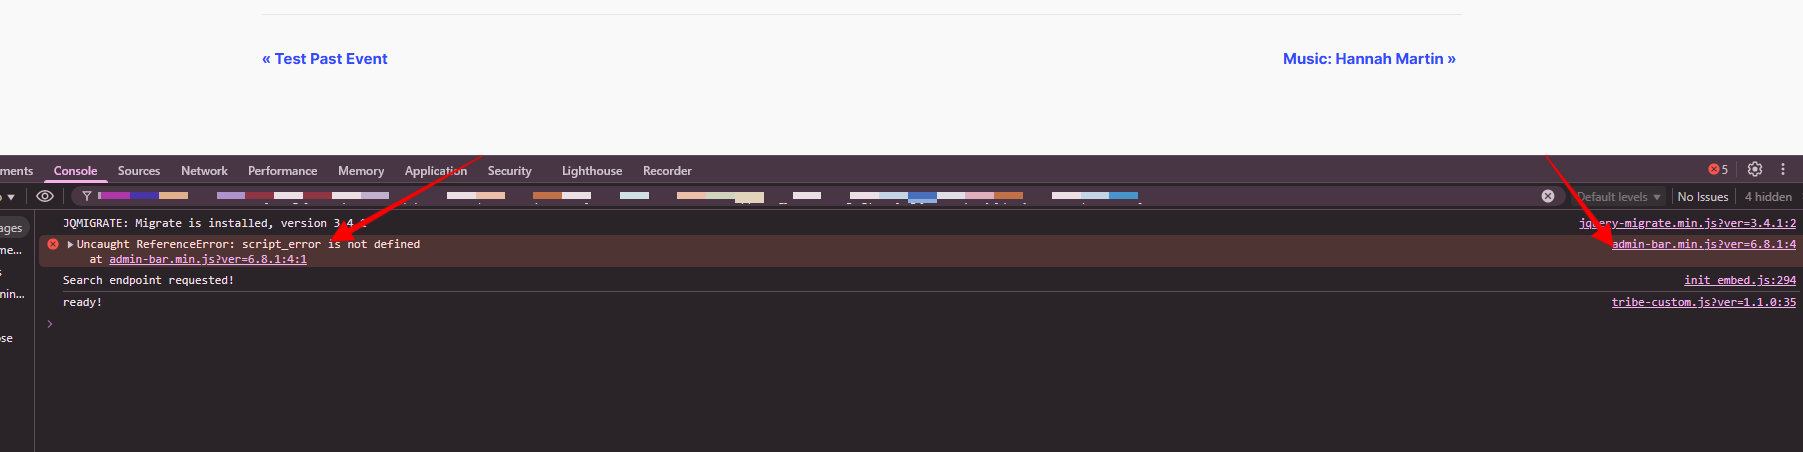 This example shows that the conflict is coming from admin-bar.min.js
 - Take a screenshot
Make sure the screenshot shows:- The visible part of the website
- The open Console with the error messages
- Send the screenshot to our support team
If possible, include a brief description of what you were doing when the error occurred.
Note: If you don’t refresh the page after opening the Console, the error may not appear, which can make it harder to troubleshoot.
Example of a Helpful Screenshot
Include the full browser window if you can. This helps us see:
- Which page you were on
- Any error messages in context
- The exact JavaScript file or plugin generating the error
Still Need Help?
If you’re unsure how to capture the console or which part of the error is important, don’t worry, just send what you can, and our team will guide you from there.
You can also review our Troubleshooting Guide and steps to isolate problems.